by abduzeedo
Evrone.com, Natasha Yankelevich, Dmitry Grenev, Denis Bezrukov shared a UI/UX project for one of the world's largest manufacturers of premium car tires. The company owns 24 factories in 13 countries.
In 2020, the Tire Plant, decided to develop a manufacturing analytics and IIoT system for analyzing the enterprise's production processes. But ready-made solutions "out of the box" could not offer the necessary functionality. So the company turned to Evrone with a request to develop a unique data analytics system for manufacturing production, which would allow the data to be analyzed and visualized and let them see bottlenecks.


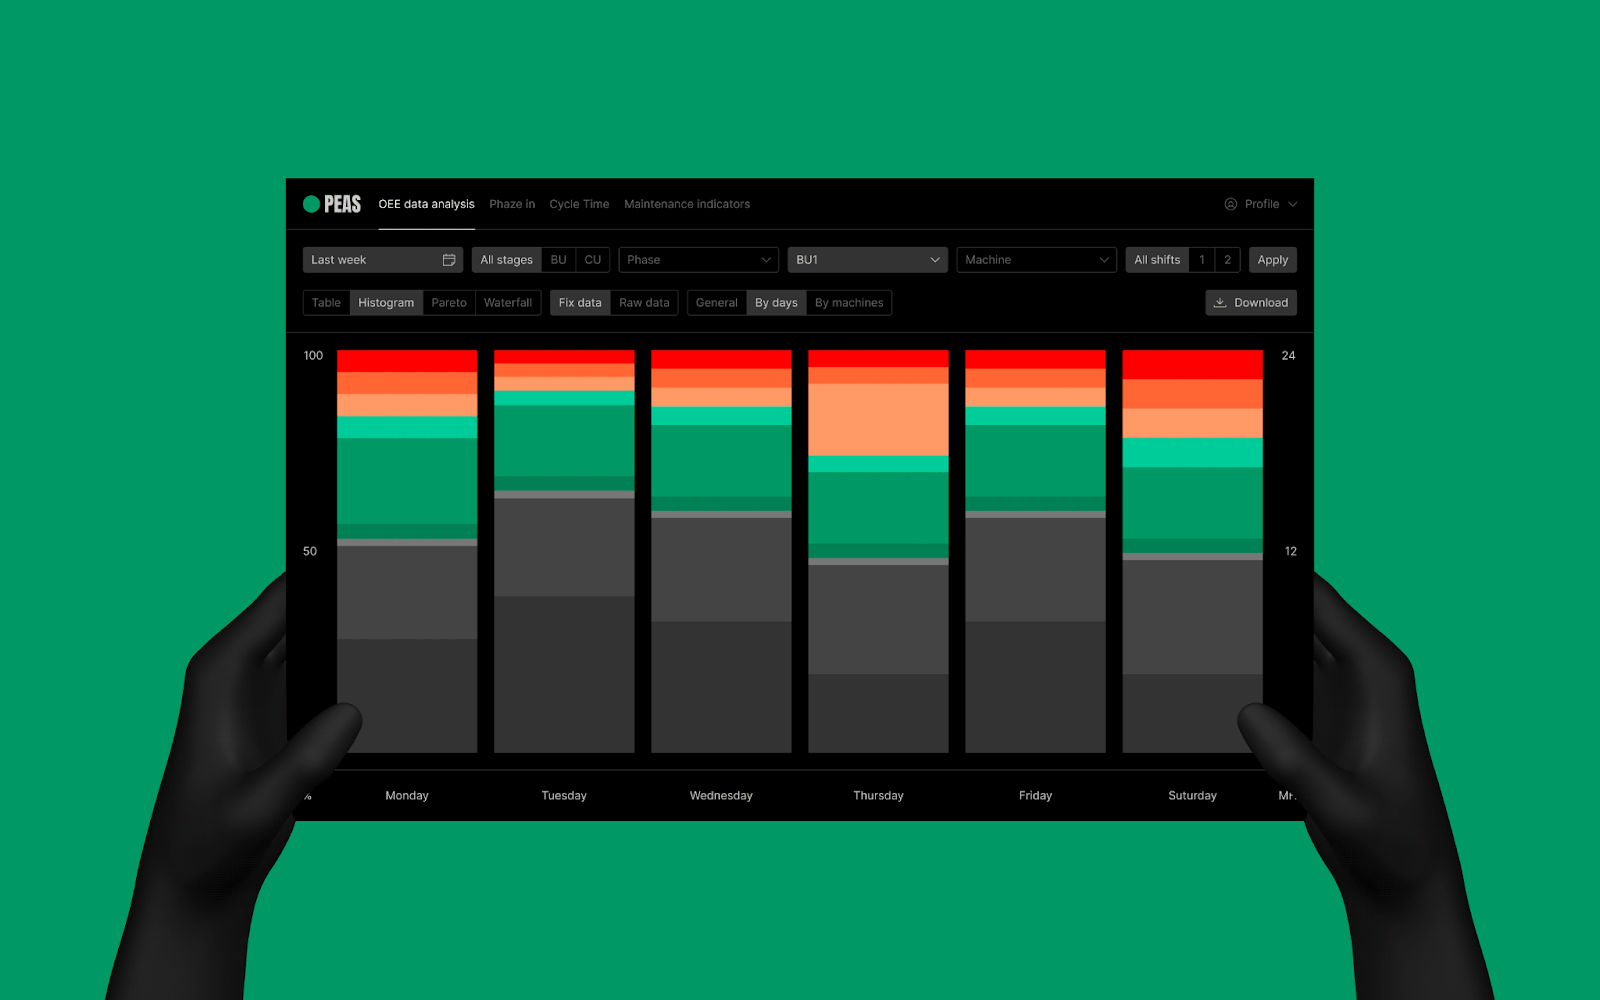
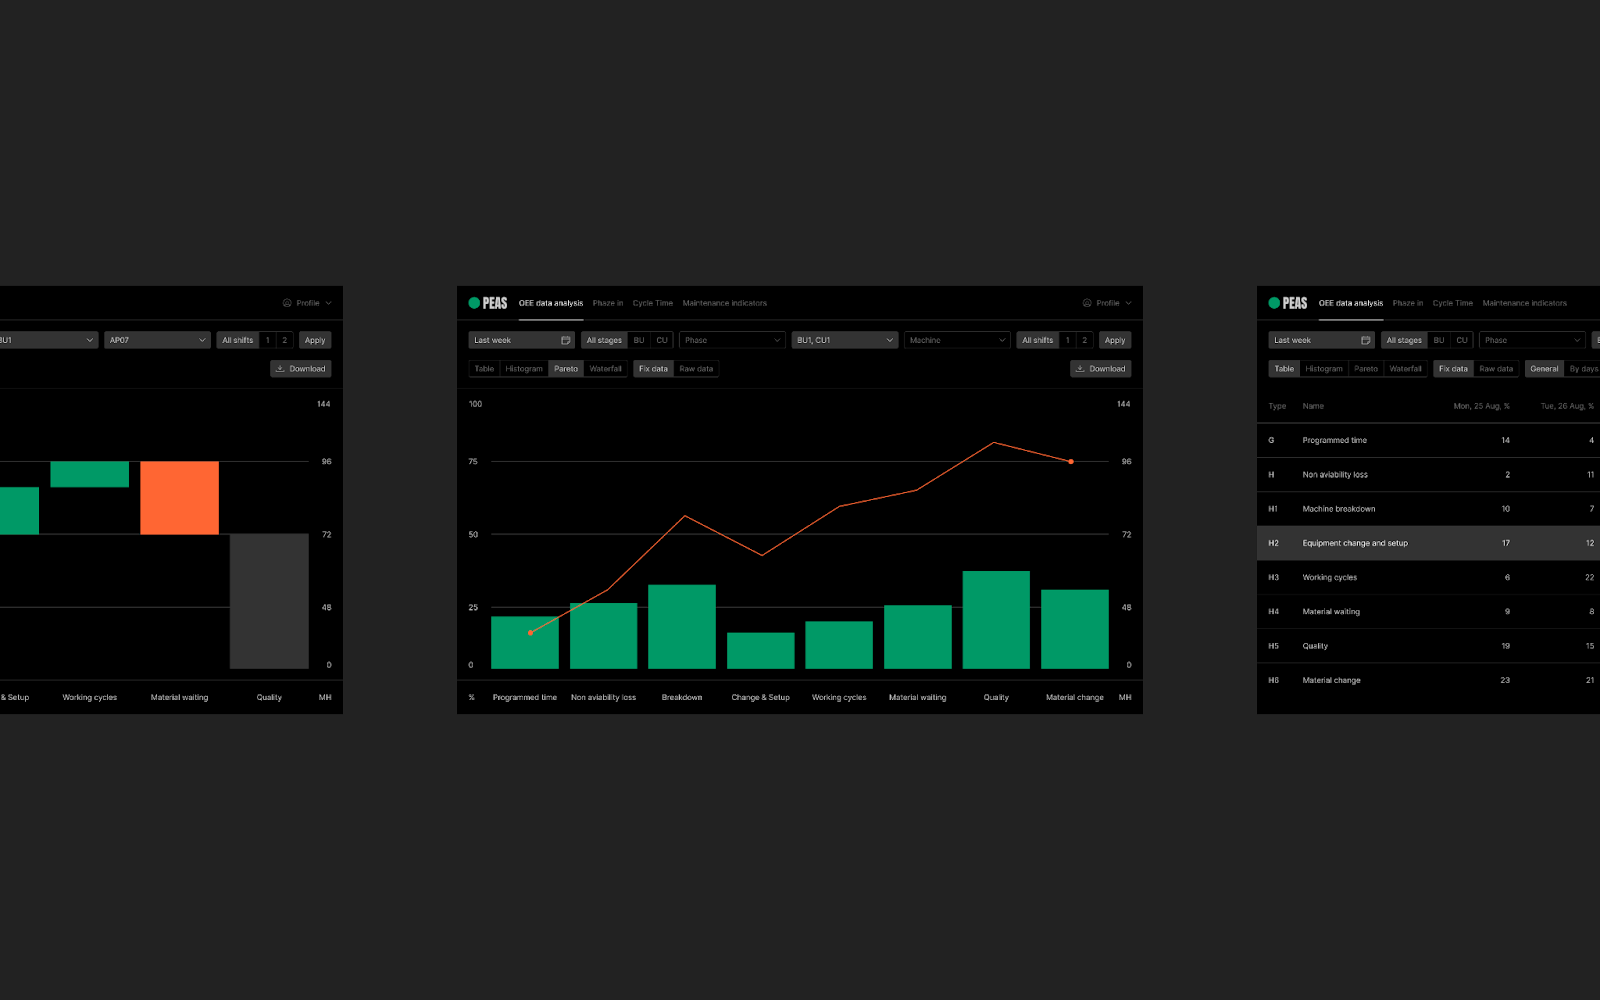
OEE data analysis
The plant has hundreds of machines that perform millions of operations every day. All the raw data on them is sent to one large common system.
With the help of the OEE section, various specialists can prepare the necessary reports on the analysis of equipment efficiency: planning, quality assessment, etc. As a result, top management collects several different reports, and based on their data, receives a general picture of production. At the same time, there can be thousands of such reports: for a shift, a day, a month, etc.
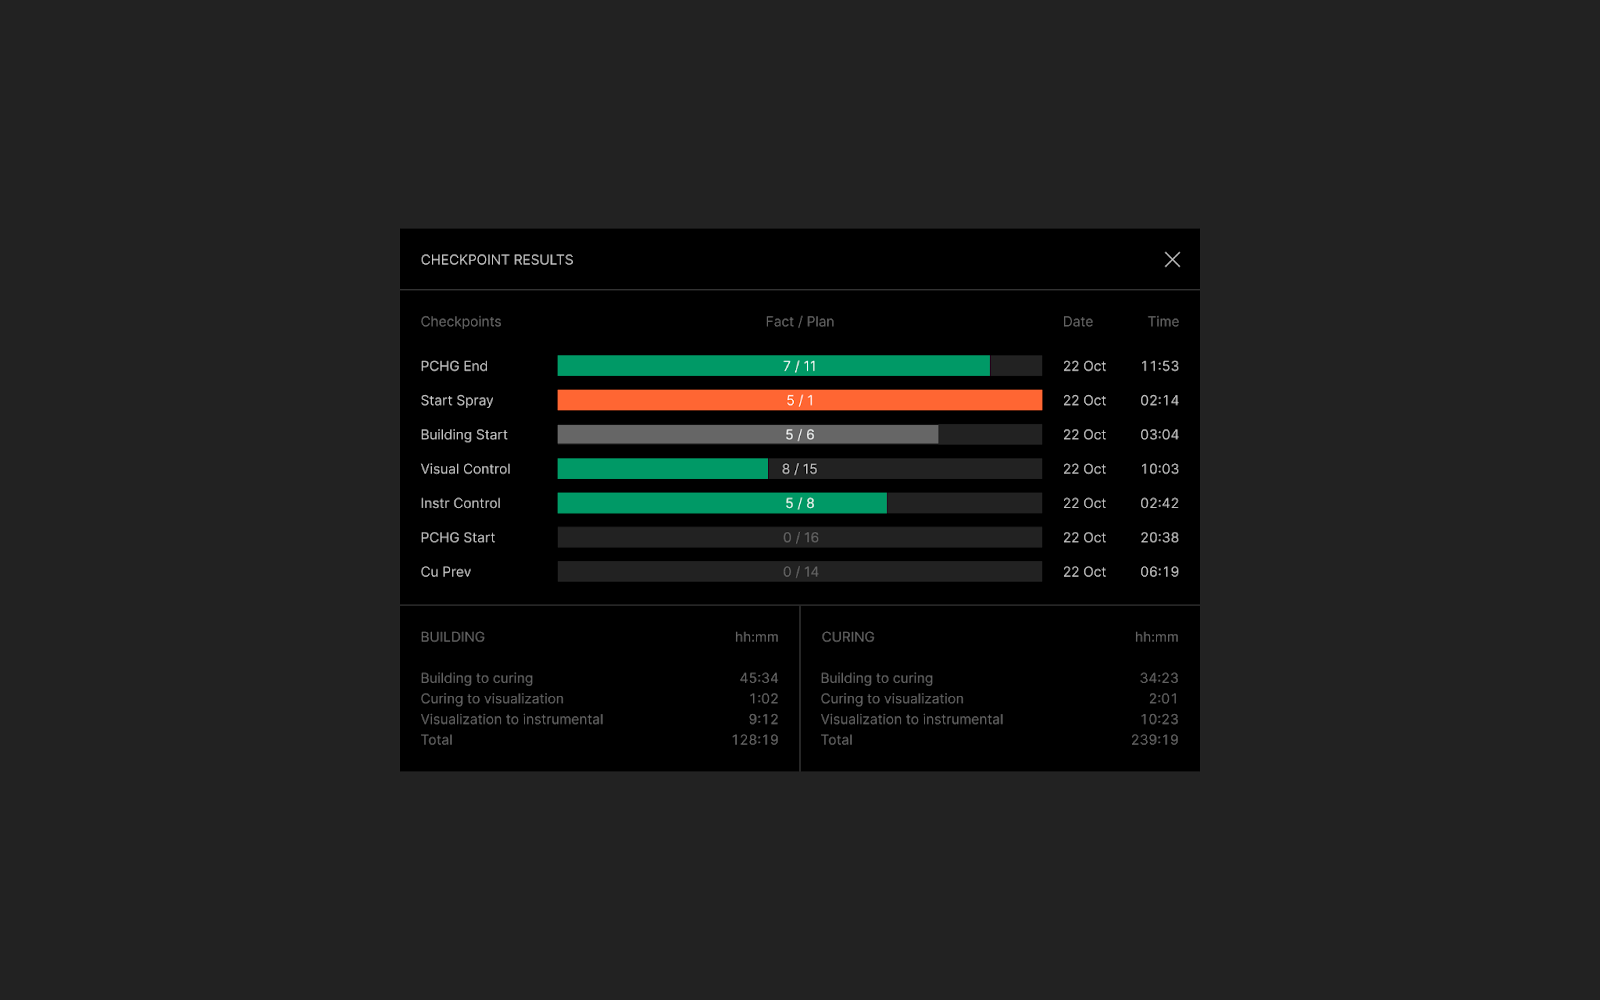
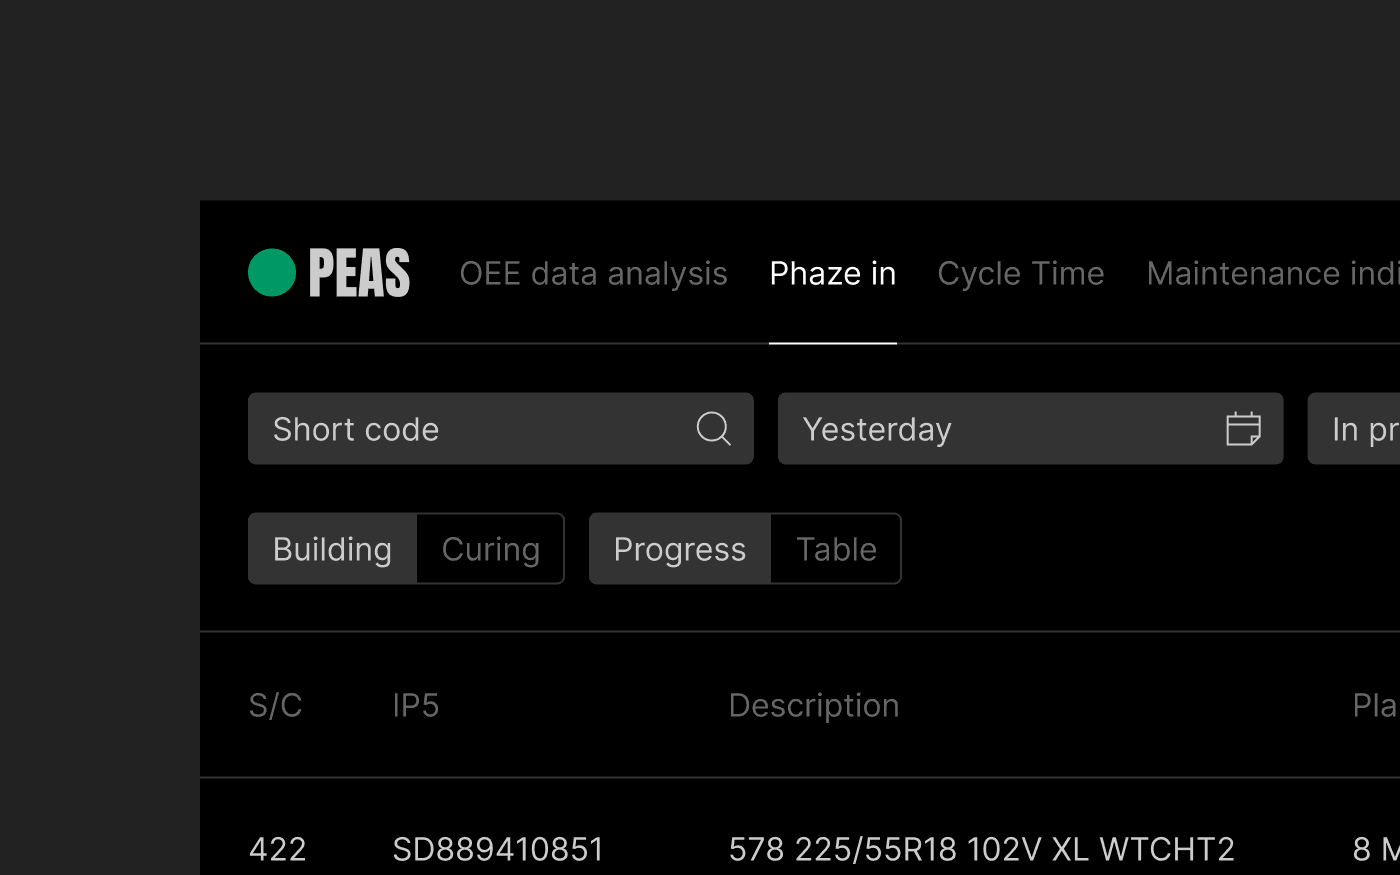
Phase in
This section helps you keep abreast of problems at each stage of production. For example, you can look at the processes for a specific type of machine and find out if everything is going according to plan.
Each stage of production has checkpoints with a specific deadline. In the system, you can see the details on whether the process is behind or is going according to the planned schedule. Color coding helps you to understand the situation at one glance.


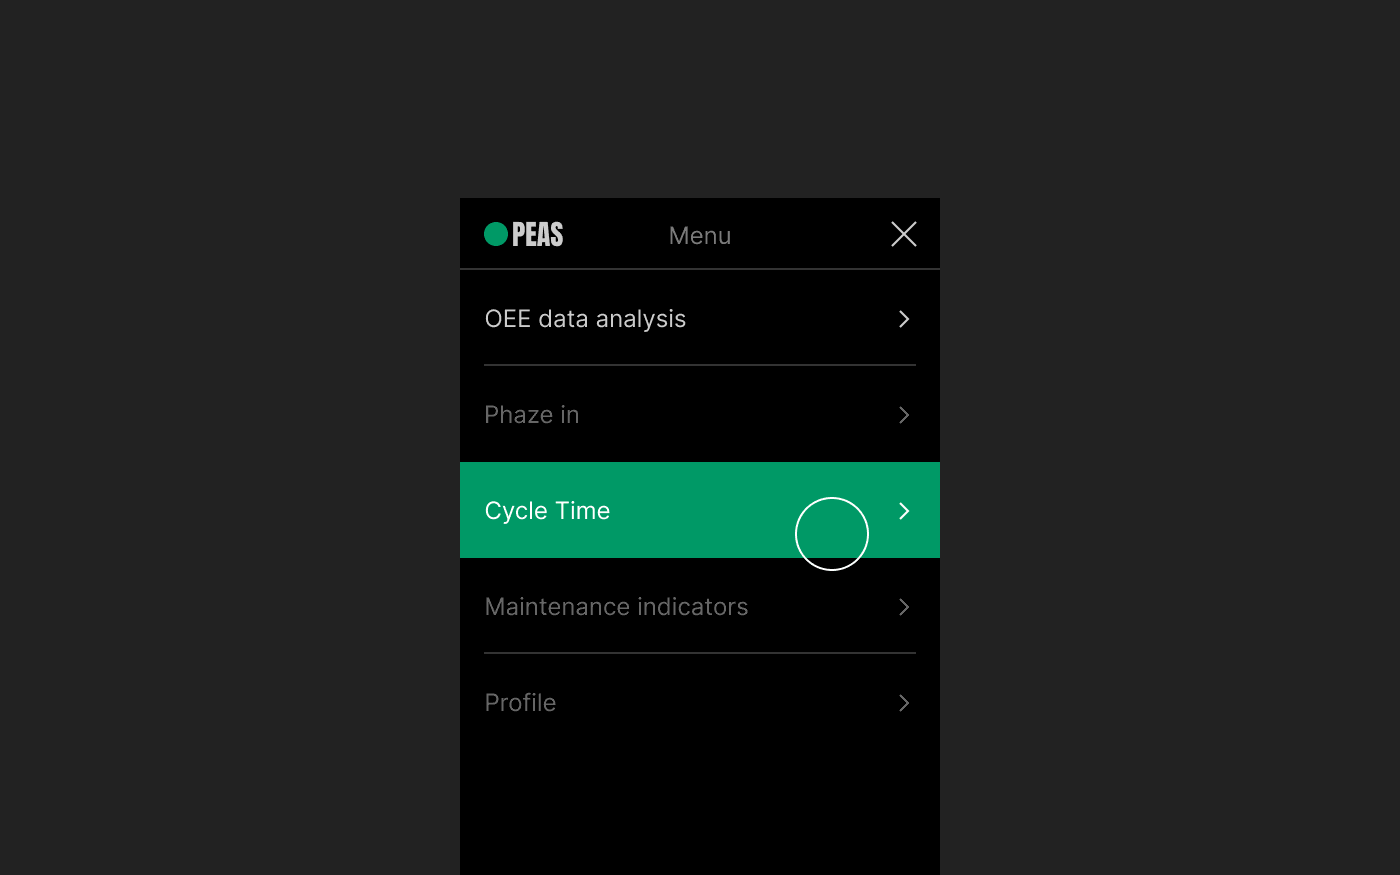
Responsive layout
Plant employees do not always work at monitors, sometimes data is needed in production facilities. Specifically for such cases, we designed an interface for mobile devices.


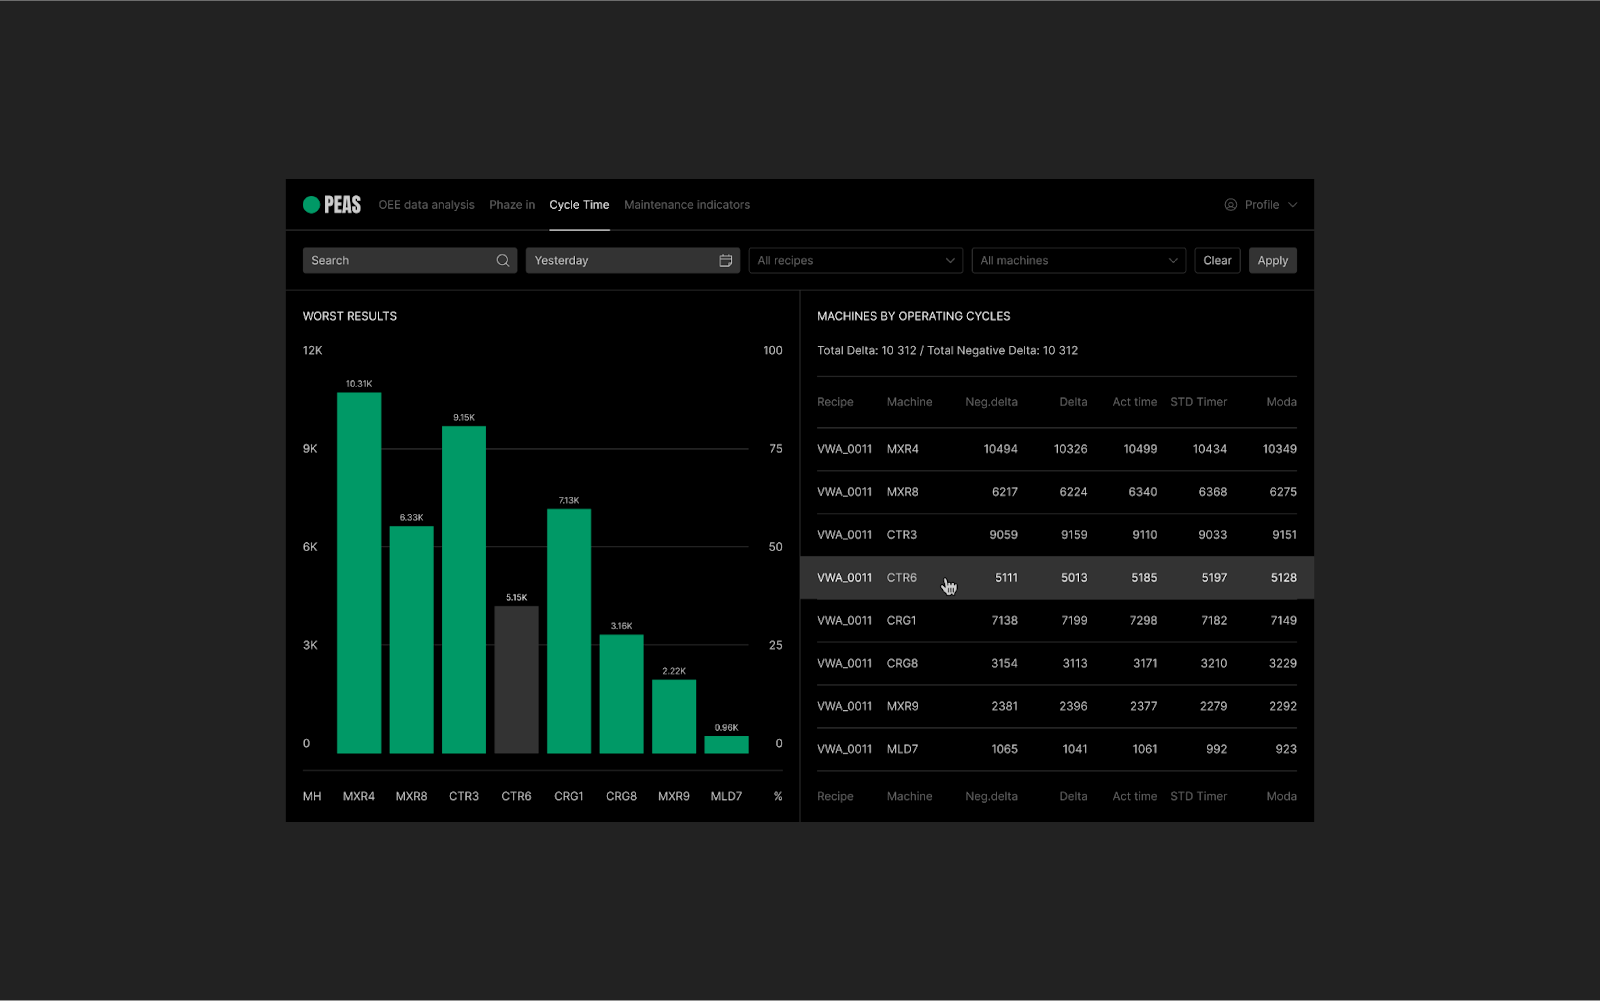
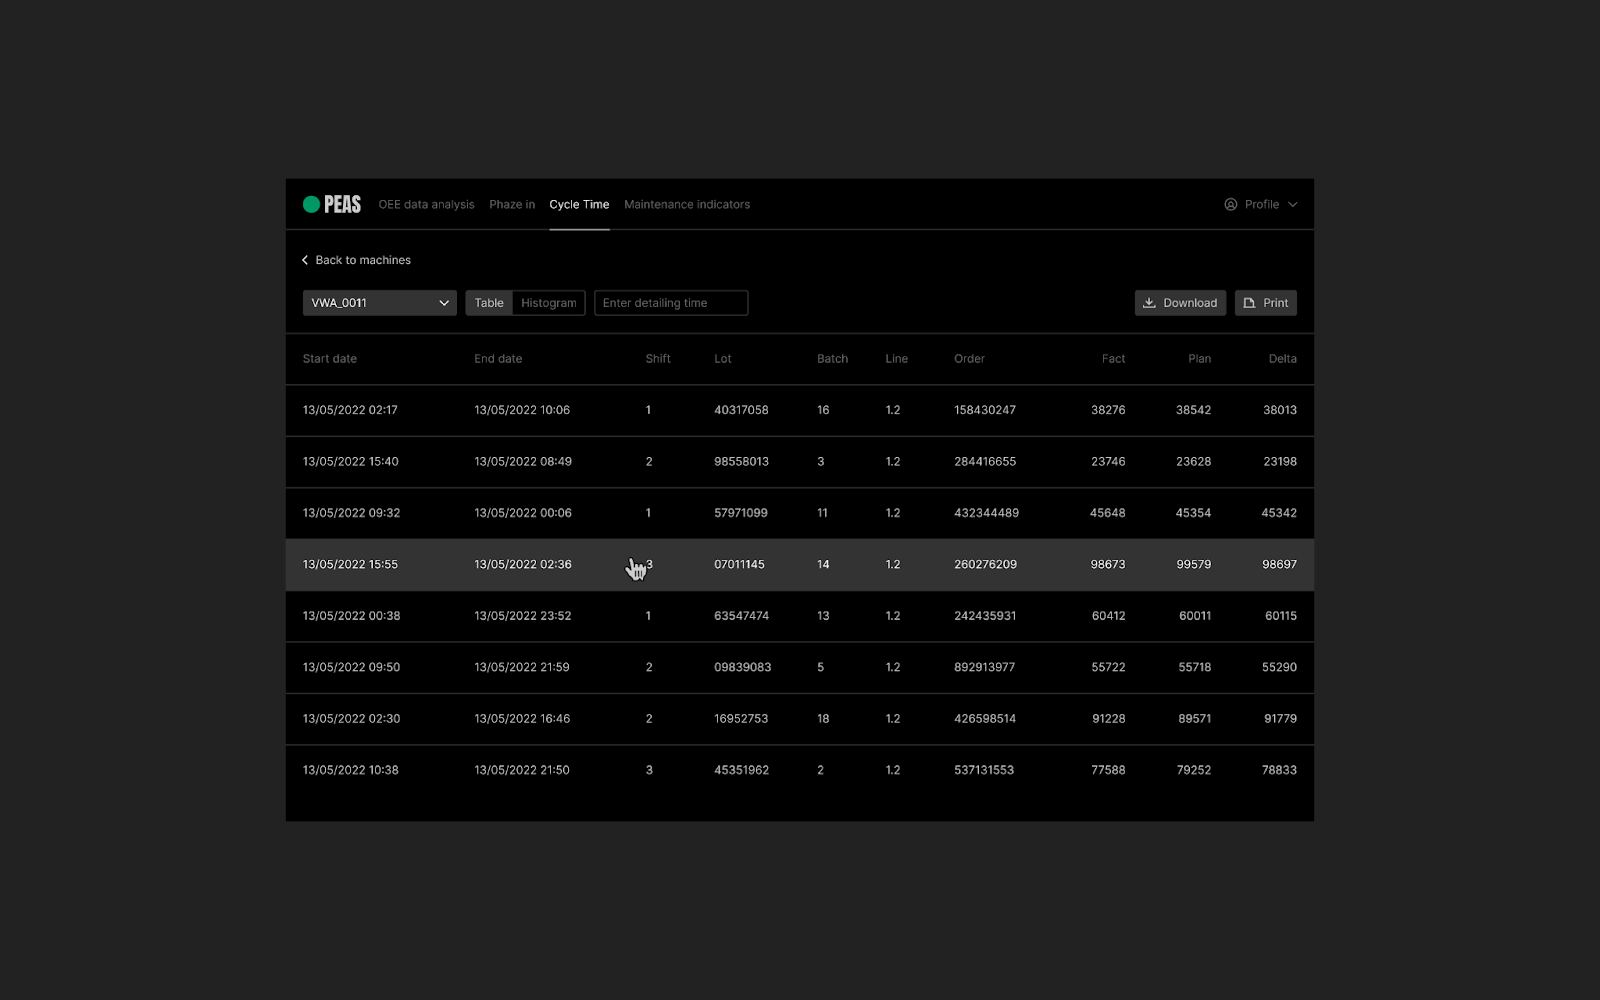
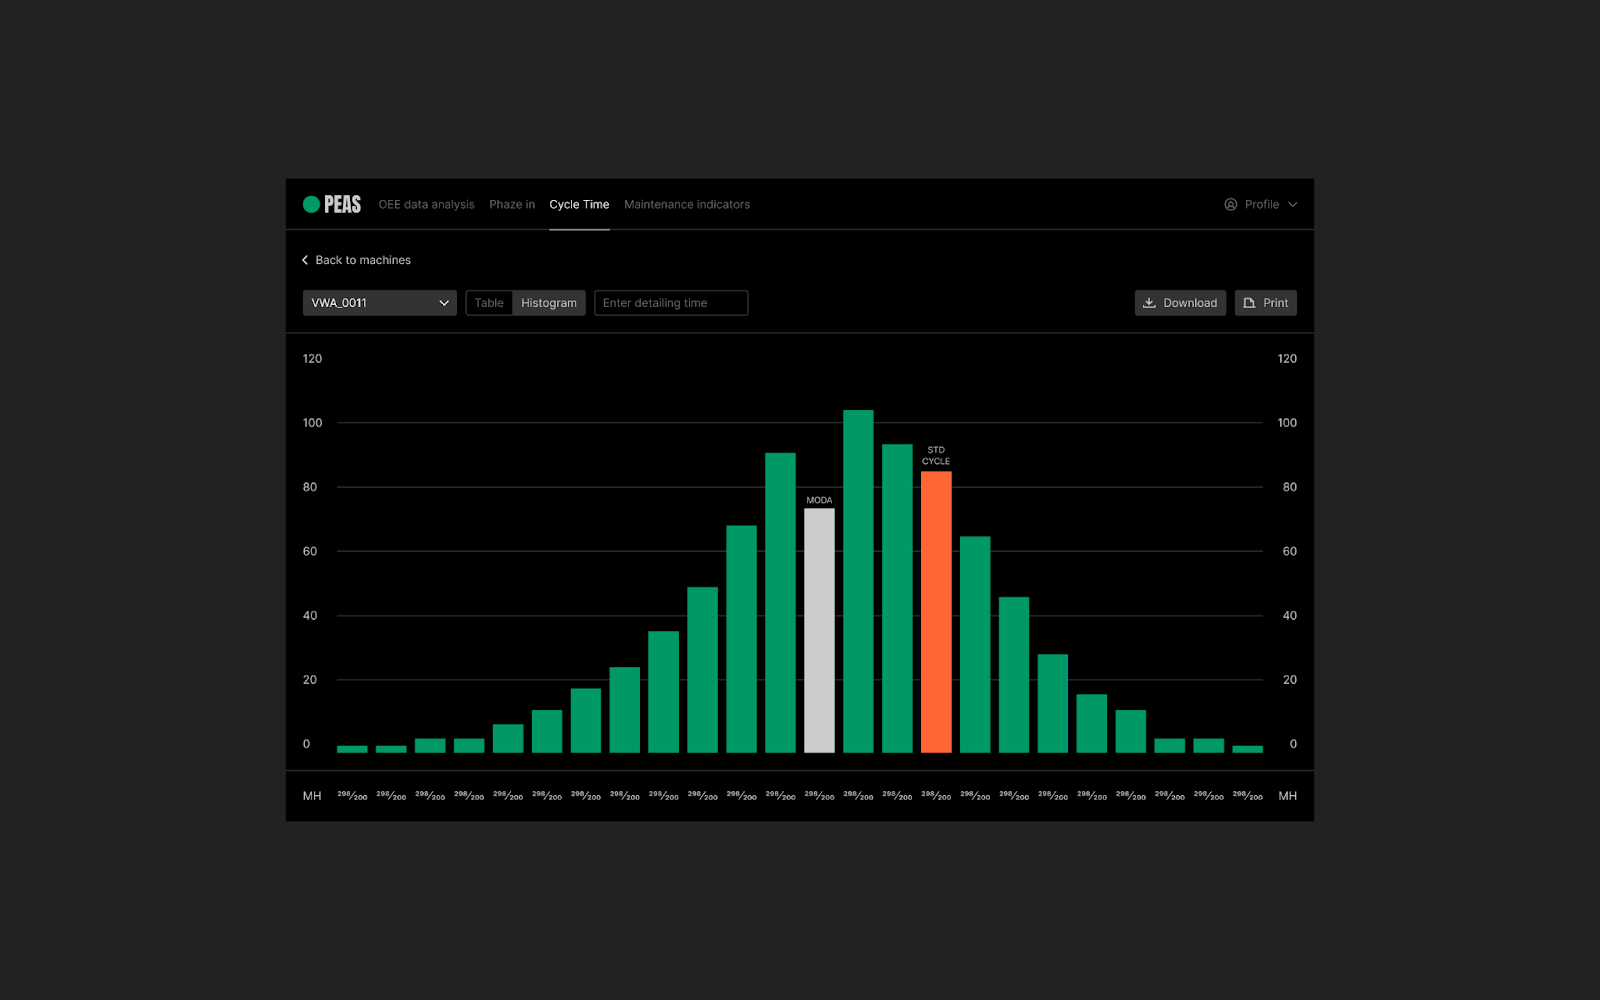
Cycle Time
Most of the factory is occupied by an industrial mixer that mixes the necessary components to obtain a homogeneous composition for further tire production. The composition of rubber compounds differs depending on which tire will be produced. This means that, for each type of tire, the client team uses its own technological recipe. In accordance with the task in hand, the necessary components are mixed in a certain order, at the right temperature, under the strict control of the operator.
The Cycle Time section helps you see exactly which machines are working with which recipes and how well it works according to the production plan.
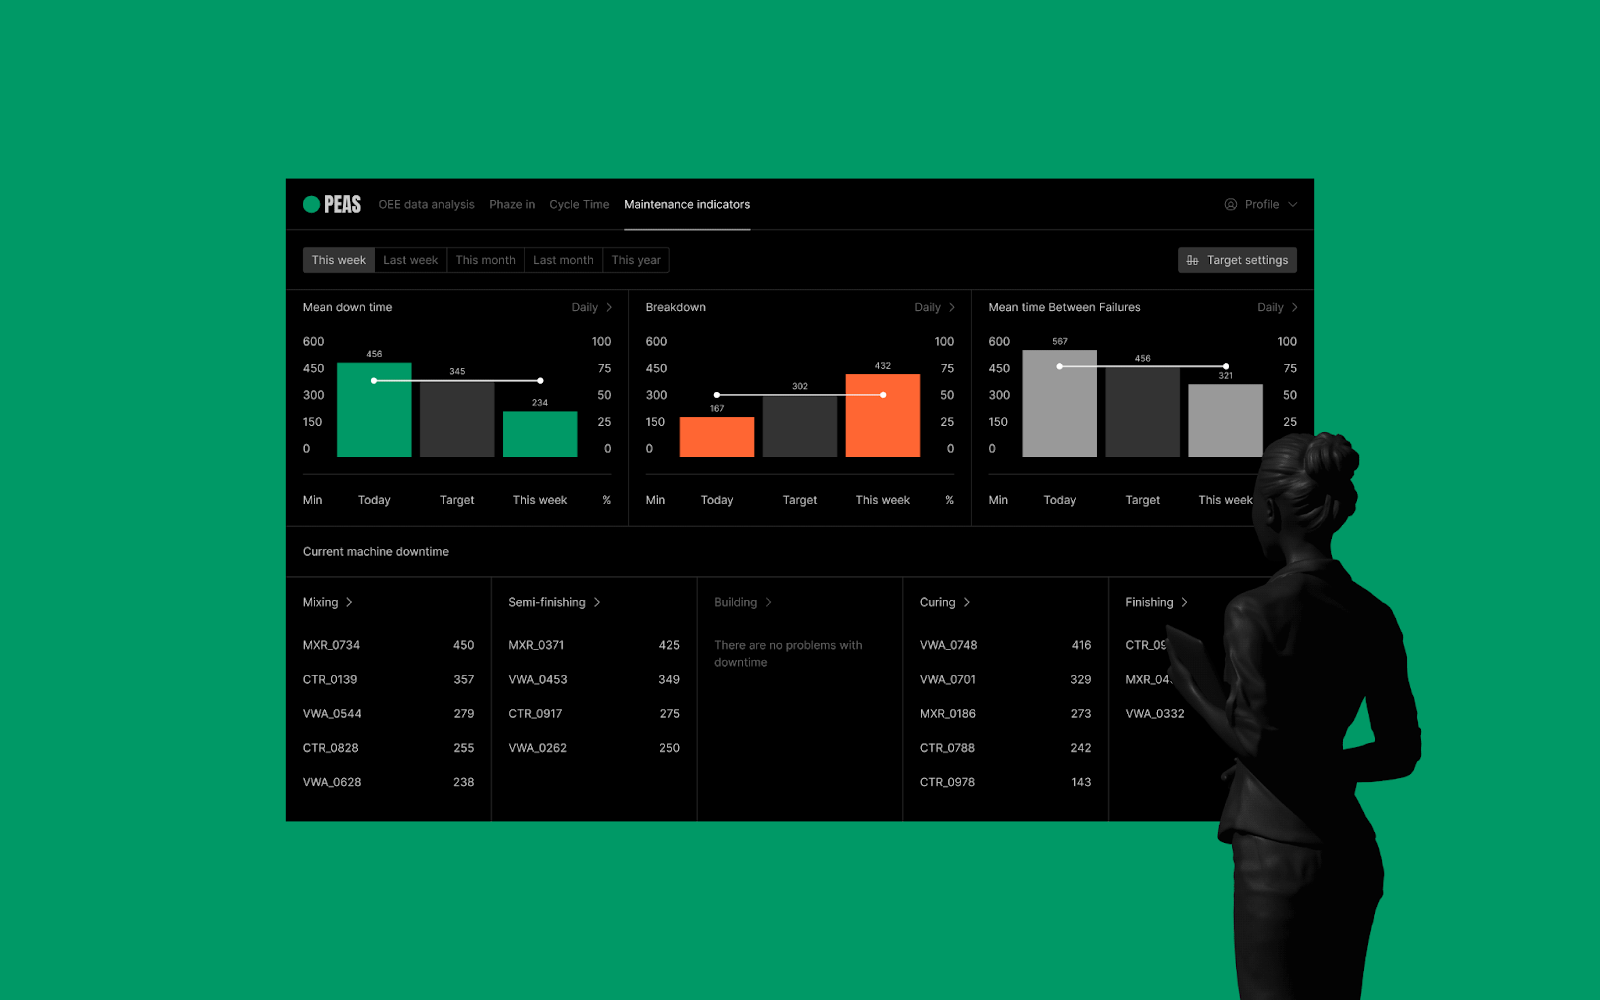
Maintenance Performance Indicators
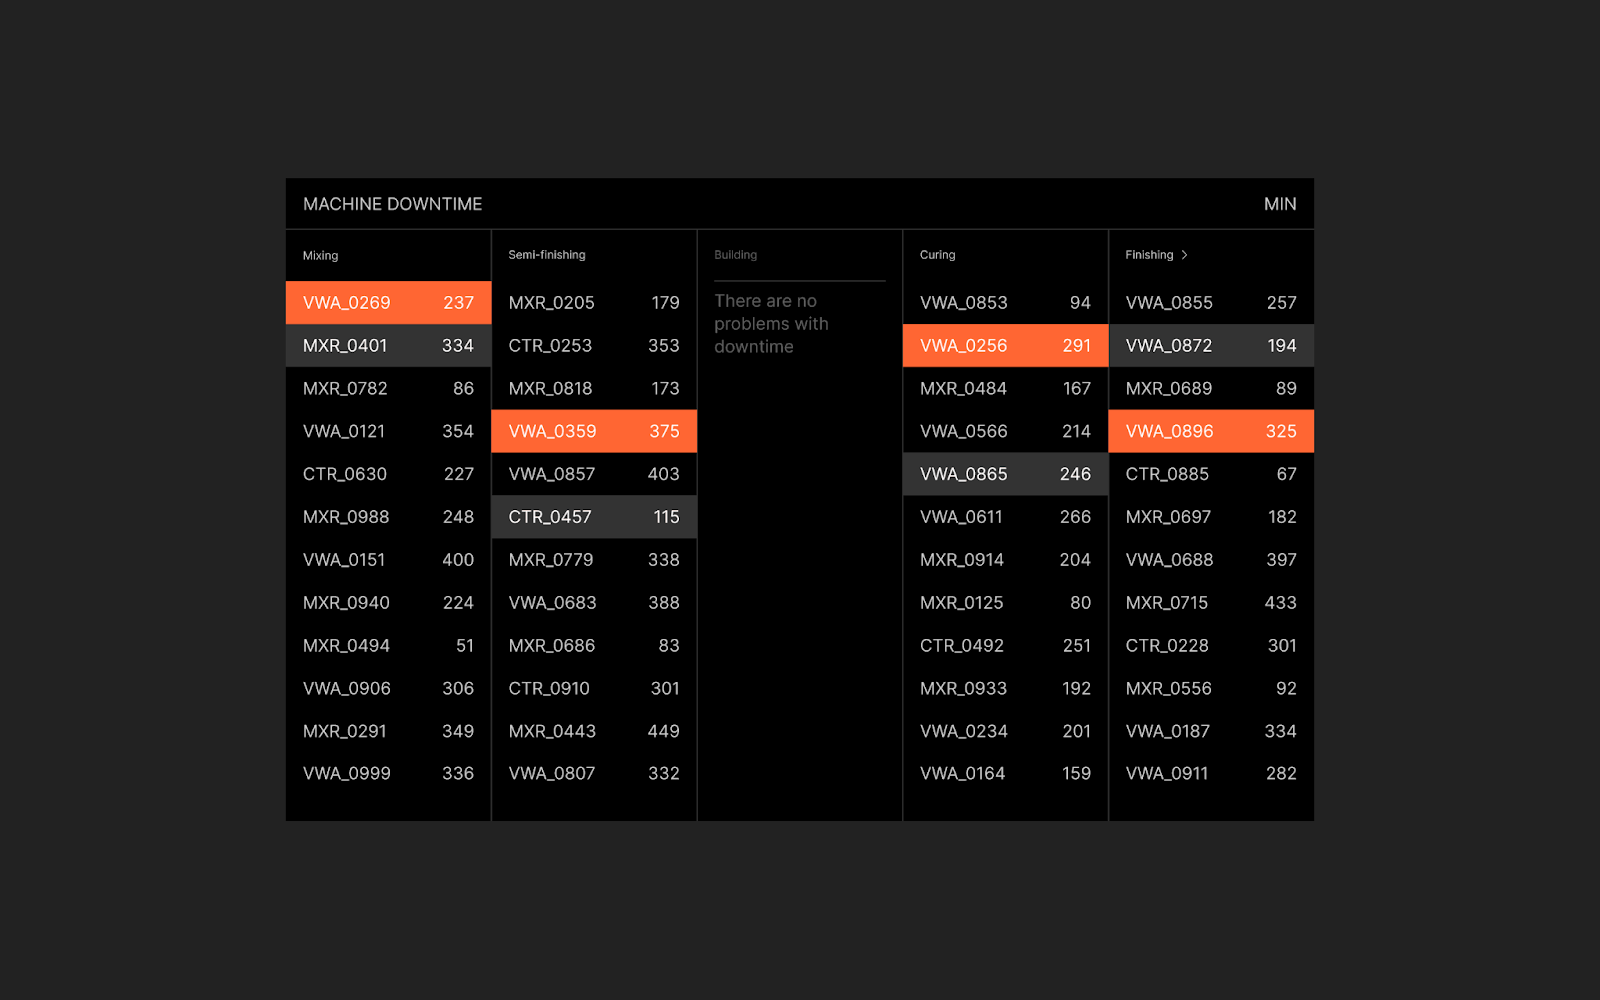
The following section helps you navigate the operational nuances of maintenance. Here, you can see how often and for what reasons machines are idle. Data is analyzed to determine downtime details: which machines fail most often, which breakdowns are the most common, and which machines have been idle for a critically long time.
This section is displayed on large screens in production areas as an identifier for operational problems. Operators see statistics in the process of work and adjust their actions depending on new inputs. This is the Internet of Things in action.

Miscellaneous
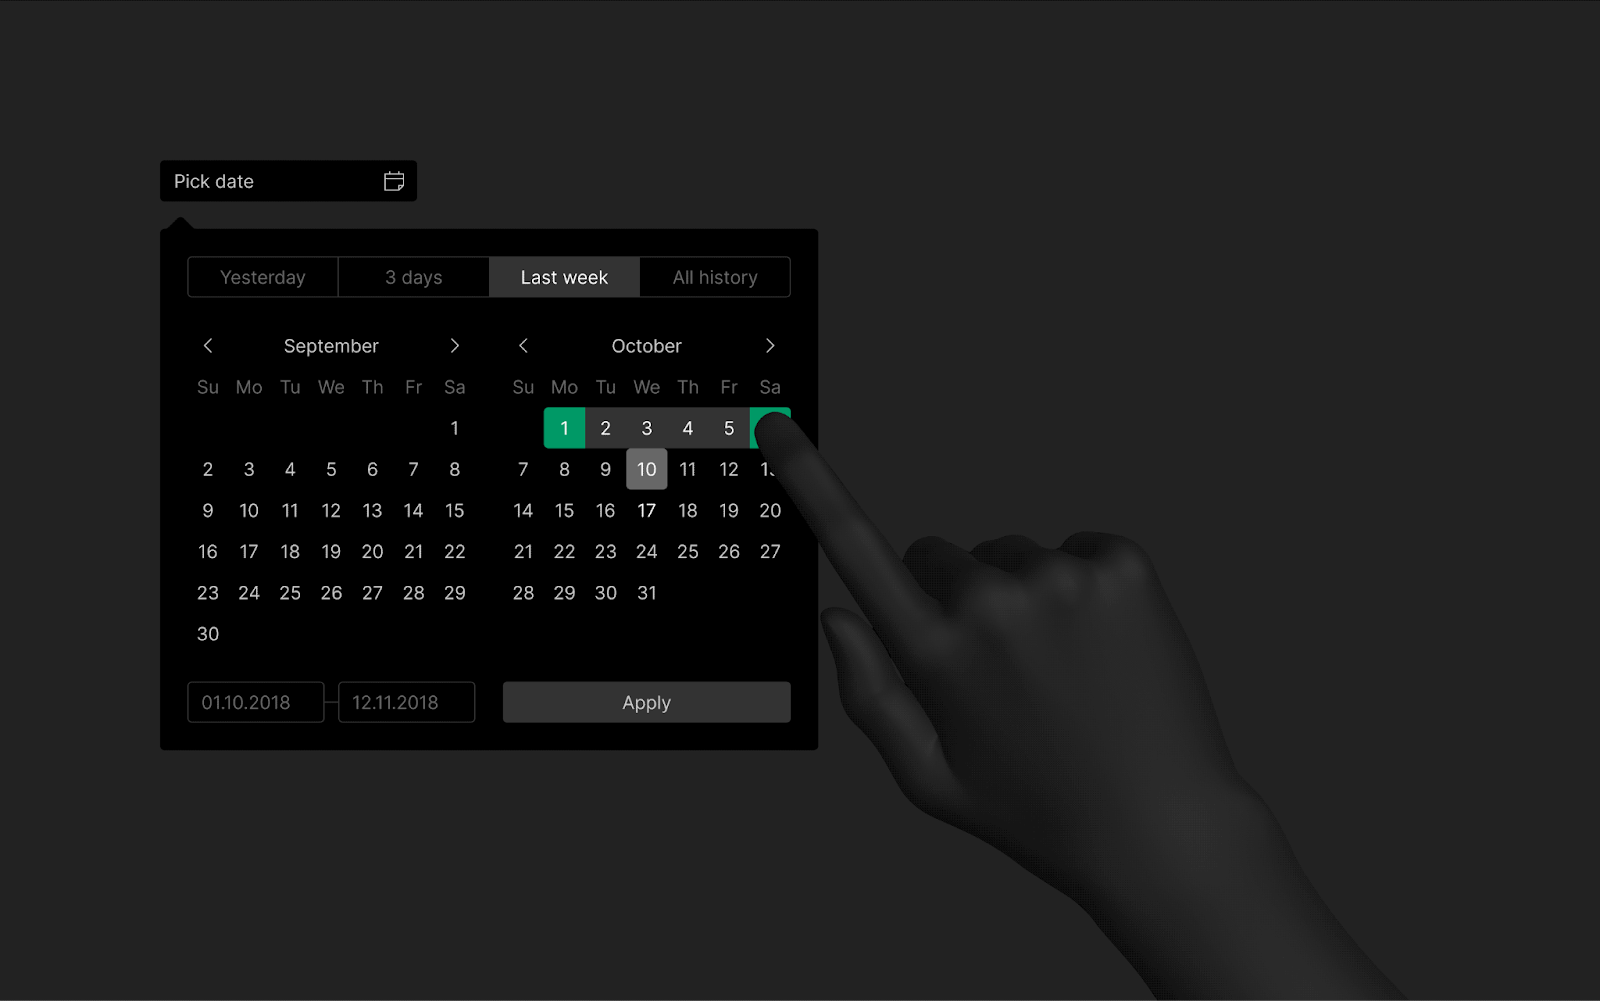
During the design process, we checked the needs of users—even with small issues—and took them into account in the final decisions. For example, the employees who are responsible for the efficiency of the machines are most often interested in data for the previous day, for the last three days, and for the last week. So we made the most popular periods available for quick access, so you can view the required reporting in fewer clicks.
Plant employees do not always work at monitors. Sometimes data is needed in production facilities. So for these cases, we designed a view for mobile devices as well.


Credits
- Design: Natasha Yankelevich, Dmitry Grenev, Denis Bezrukov
- Management: Katerina Berkun, Anton Komarov
- Presentation: Denis Bezrukov
Check out our case studies with thoughtful UI/UX design & ERP development. Read the case about Production Equipment Analysis System development. Made by evrone.com


