by abduzeedo
Based in New York City, Mingzhi Cai, a notable product experience designer, has developed the Advanced Data Visualization library to address the complexities in financial data presentation and reduce cognitive strain for users.
Mingzhi's inspiration for this project stemmed from her own professional challenges. She aimed to simplify the process of creating data visualizations and dashboards, addressing the common issues in financial data simplification. Her expertise in interface design and Figma played a crucial role in creating a library that prioritizes adaptability and user-centric design.
This tool is a game-changer in how designers and data professionals interact with data, offering a more accessible and engaging approach.
The tech industry's urgent need for effective data visualization tools is well-known. Professionals often grapple with the absence of unified solutions for data-heavy interface design. Mingzhi's library fills this void, providing customizable charts that enhance communication among designers, analysts, and engineers, and simplifying the design process.
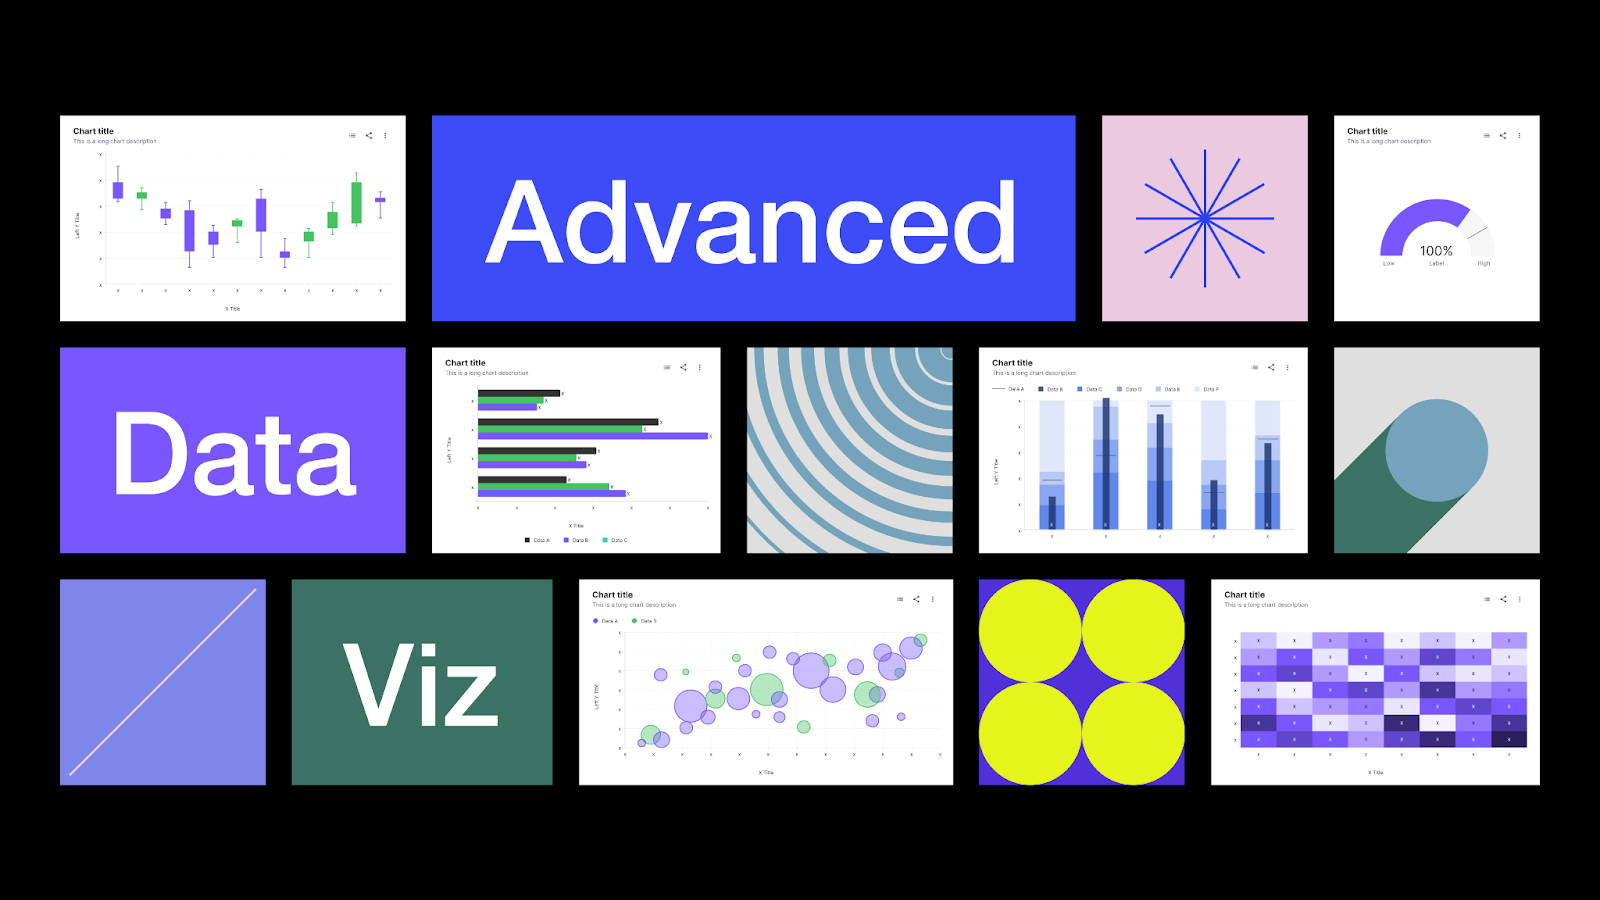
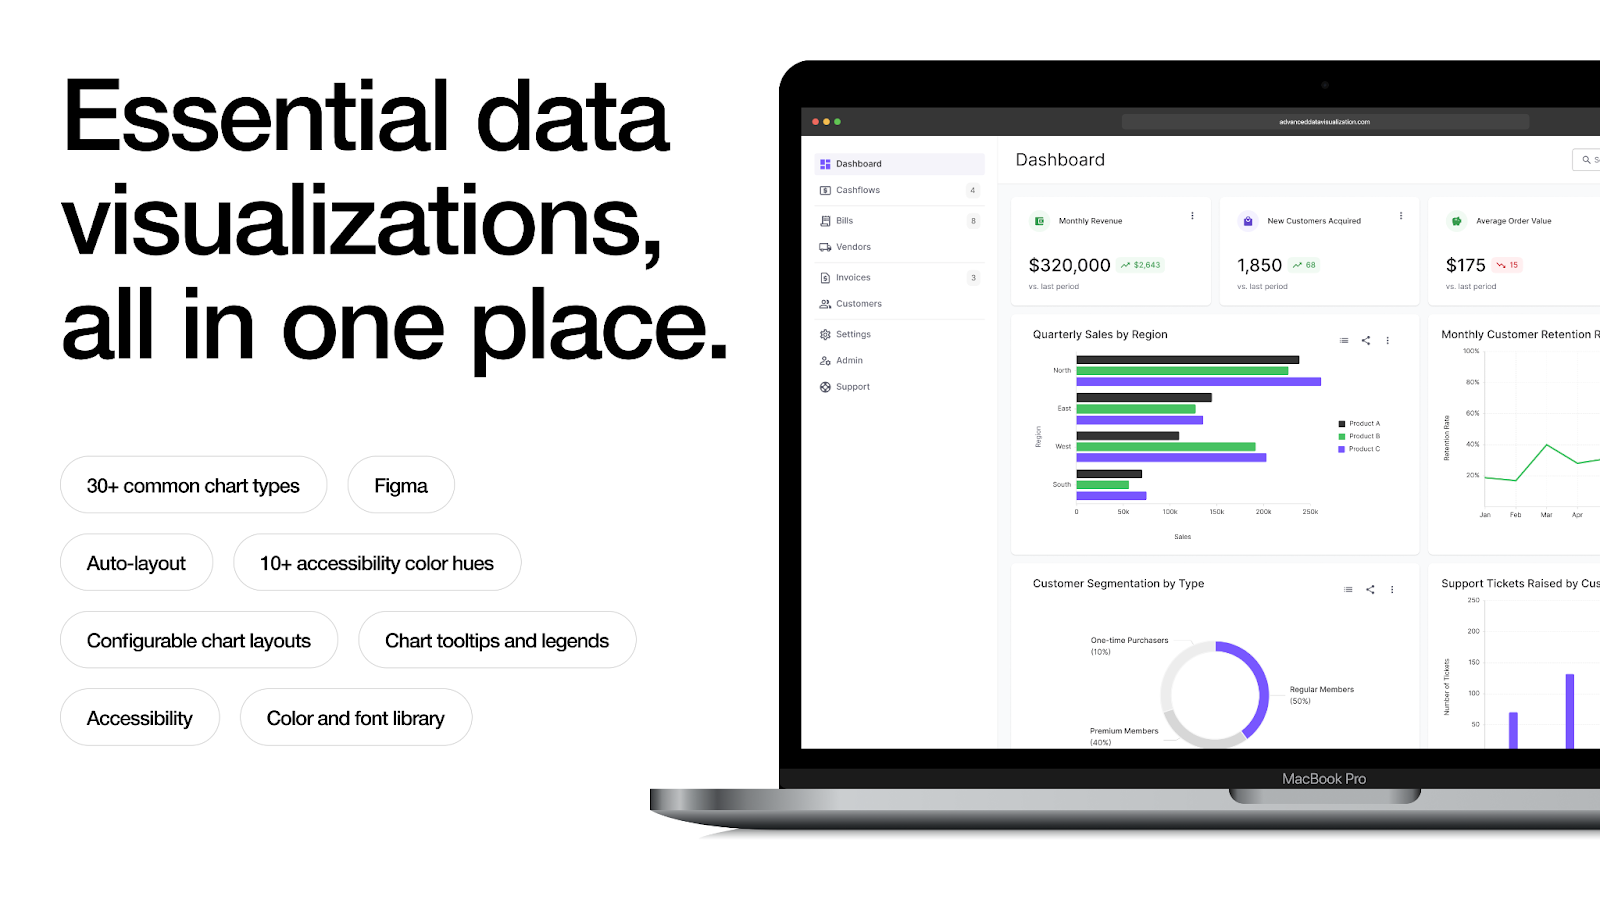
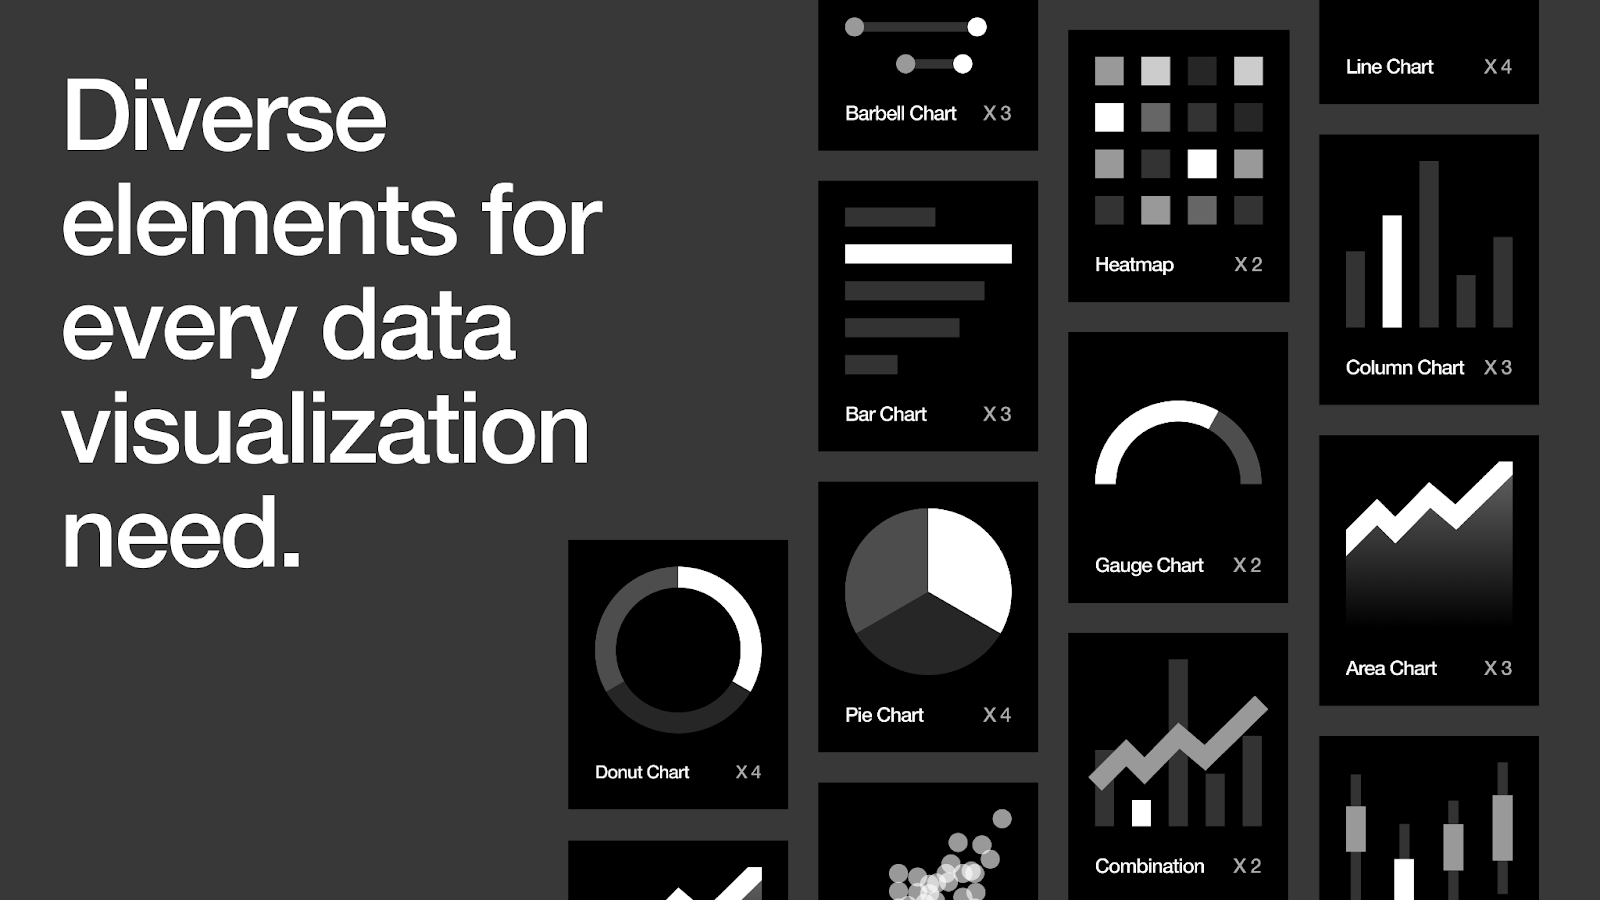
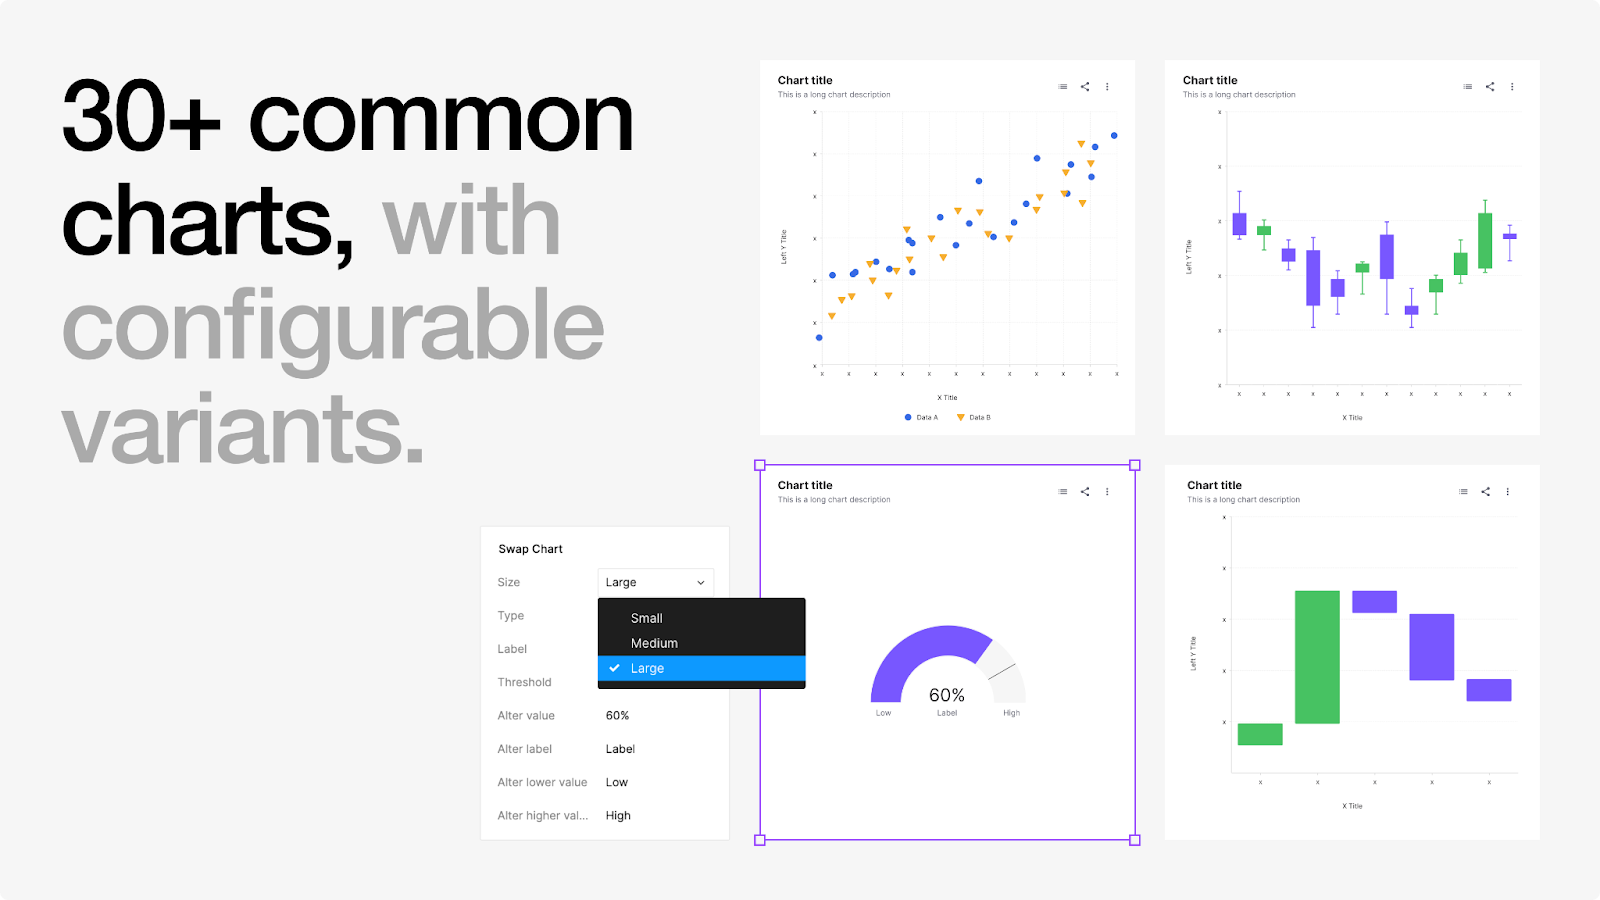
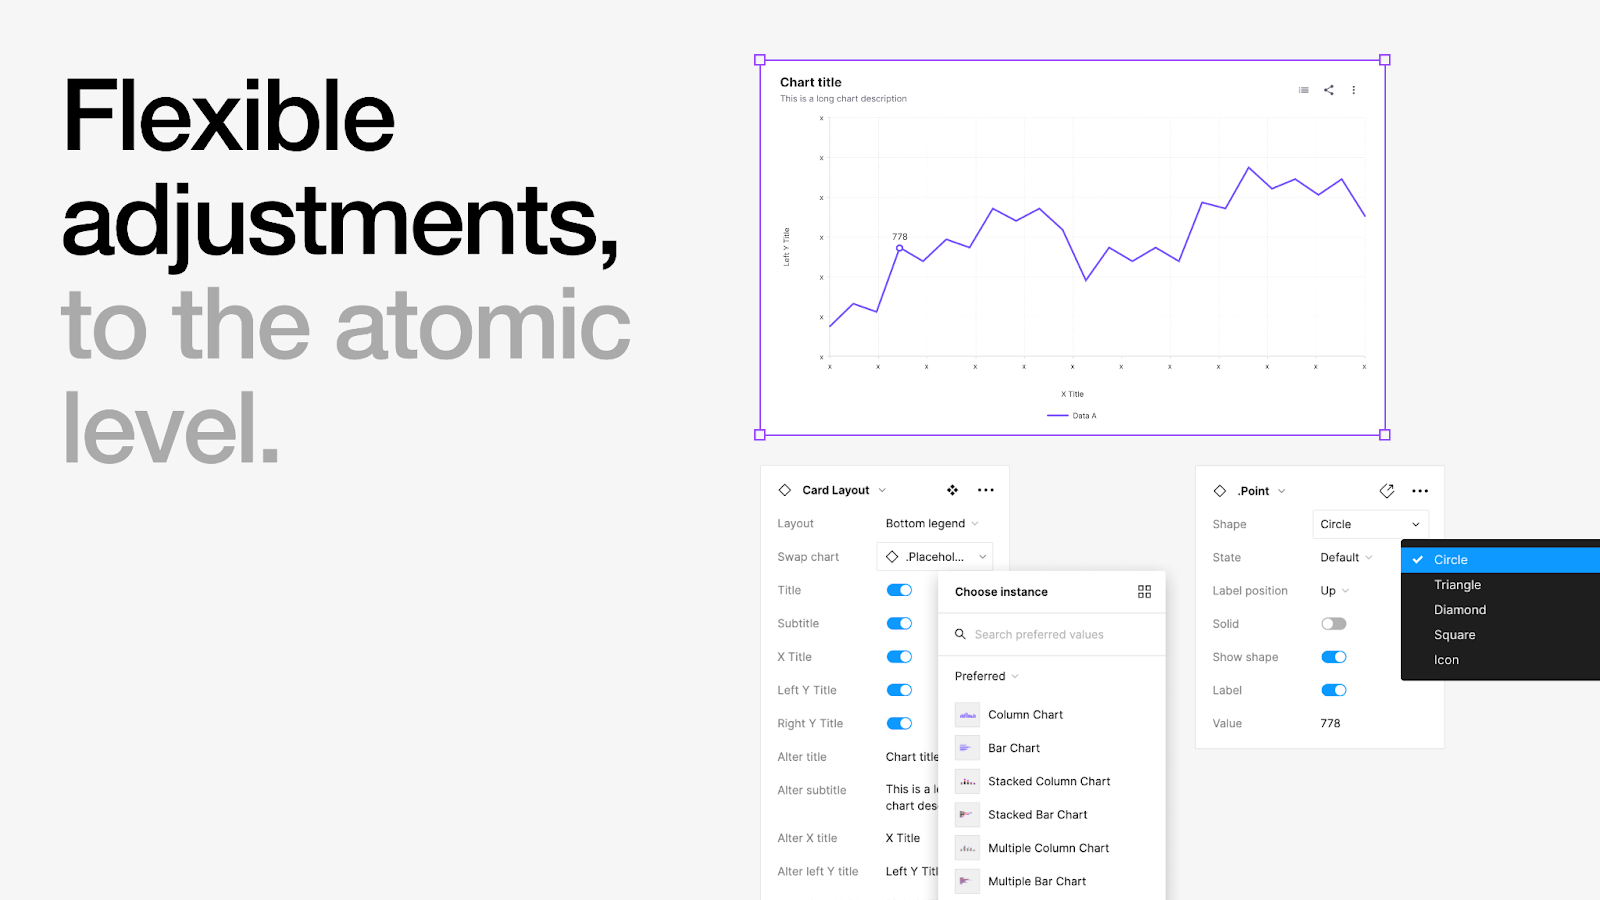
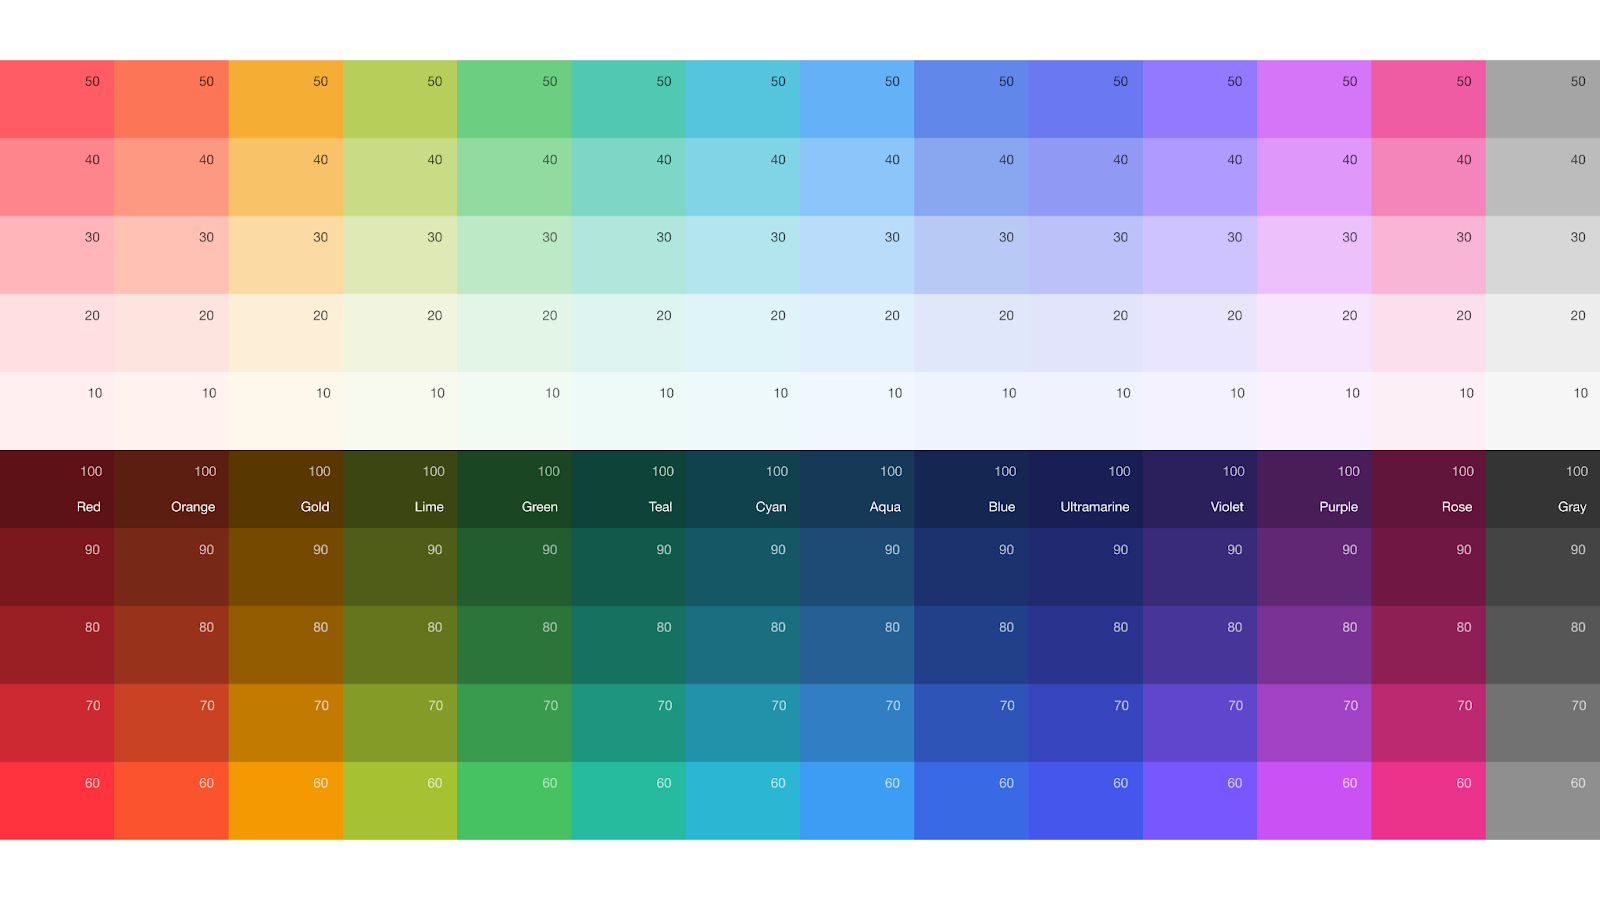
What sets the Advanced Data Visualization library apart is its comprehensive nature, featuring over 30 chart templates, configurable layouts, tooltips, legends, and a wide-ranging color palette designed for accessibility. It serves not just as a design tool but as an educational resource, providing general UI design knowledge, offering insights into data visualization, encouraging intuitive visual storytelling, and emphasizing design consistency and accessibility.
Hosted on Figma, Mingzhi's library has garnered widespread acclaim for its intuitive design and user-focused approach, reflected in its numerous downloads and high user satisfaction. Mingzhi's commitment to continuous improvement, driven by feedback from the design community, keeps the library at the forefront of relevance and effectiveness.
Ultimately, the Advanced Data Visualization library stands as a significant contribution to the fintech sector, advancing the democratization of data design. Mingzhi Cai continues to drive her vision forward, enhancing data accessibility and engagement, and empowering both designers and their audiences.
Discover more about Advanced Data Visualization in Figma.